Project Overview
The Social Vulnerability Index (SoVI®) measures the social vulnerability of U.S. counties to environmental hazards. The index is a comparative metric that facilitates the examination of the differences in social vulnerability among counties. SoVI® is a valuable tool for policy makers and practitioners because it graphically illustrates the geographic variation in social vulnerability. It shows where there is uneven capacity for preparedness and response and where resources might be used most effectively to reduce the pre-existing vulnerability. SoVI® also is useful as an indicator in determining the differential recovery from disasters using empirically-based information.
The index synthesizes 29 socioeconomic variables, which the research literature suggests contribute to reduction in a community’s ability to prepare for, respond to, and recover from hazards. SoVI® data sources primarily include those from the United States Census Bureau.
The data are compiled and processed by the Hazards Vulnerability and Resilience Institute at the University of South Carolina. The data are standardized and placed into a principal components analysis to reduce the initial set of variables into a smaller set of statistically optimized components. Adjustments are made to the components’ cardinality (positive [+] or negative [-] ) to insure that positive component loadings are associated with increased vulnerability, and negative component loadings are associated with decreased vulnerability. Once the cardinalities of the components are determined, the components are added together to determine the numerical social vulnerability score for each county.
SoVI® 2010-14 marked a change in the formulation of the SoVI® metric from earlier versions. New directions in the theory and practice of vulnerability science emphasize the constraints of family structure, language barriers, vehicle availability, medical disabilities, and healthcare access in the preparation for and response to disasters, thus necessitating the inclusion of such factors in SoVI®. Extensive testing of earlier conceptualizations of SoVI®, in addition to the introduction of the U.S. Census Bureau’s five-year American Community Survey (ACS) estimates, warrants changes to the SoVI® recipe, resulting in a more robust metric. These changes, pioneered with the ACS-based SoVI® 2006-2010, carry over to SoVI® 2010–14 and SoVI® 2019, which combine the best data available from the 2010 U.S. Decennial Census and five-year estimates from both the 2010–14 ACS and the 2015-19 ACS. Additional innovations in SoVI® by HVRI collaborators are available.
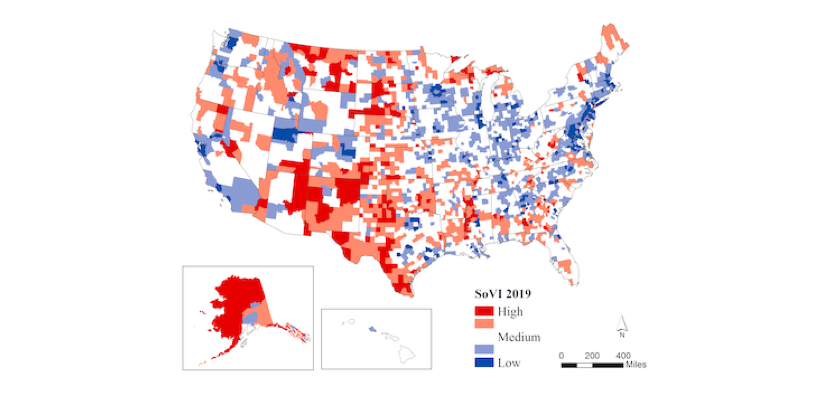
SoVI was updated in 2019 using the five-year American Community Survey data from the U.S. Census. For SoVI 2019 seven significant components explain 73% of the variance in the data. These components include wealth; race and social status; age dependency (elderly); Hispanic ethnicity and people without health insurance; special needs populations; Native American populations; and service sector employment. Detailed information on these components is available [PDF].
To visually compare the SoVI scores at a national level, they are mapped using standard deviations from the mean. Scores in the top 16% are mapped in orange/red, while counties in the bottom 16% are mapped in shades of blue. The darkest hues (red and dark blue) represent the most and least socially vulnerable counties, respectively.