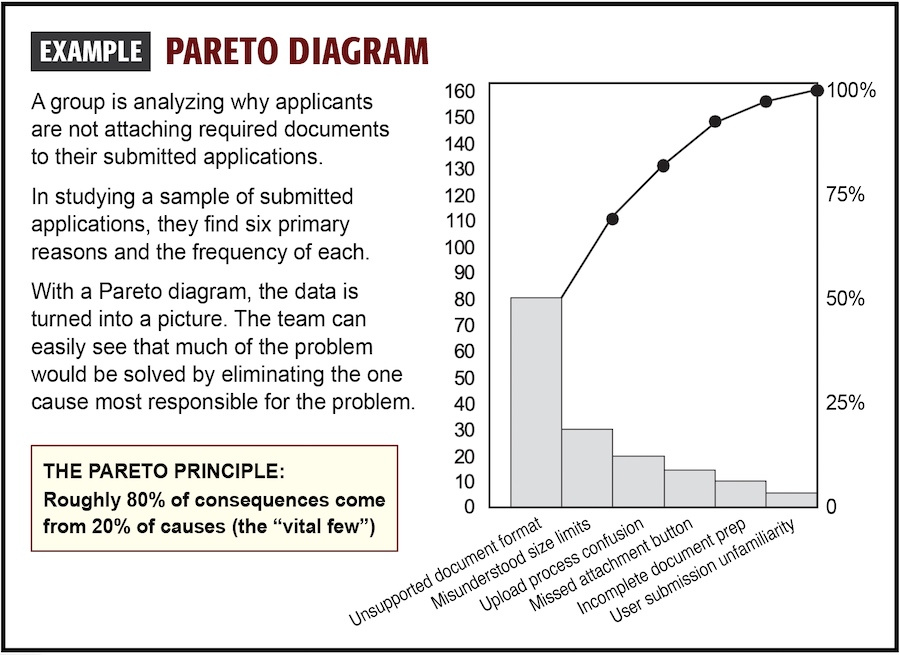
A Pareto diagram helps you discover which causes or issues are the biggest factors in giving rise to a problem. The name comes from the Pareto Principle, which states that roughly 80% of the effects come from 20% of the causes. The Pareto diagram is truly a visual tool – once the graph is created, the tallest bars show what is most contributing to the problem. This knowledge is essential to effective problem solving.
Video: ![]() Whiteboard demo of Pareto analysis (7 min.)
Whiteboard demo of Pareto analysis (7 min.)
Visual example:
Click to expand – will open in a new window
Note: A Pareto diagram is created in advance, typically with input from the group. The finished diagram is then shared and discussed at a meeting.
Step by step to create a Pareto diagram:
1. List the issues: Get clear on the problem that's being studied – then identify the likely contributing causes/factors to analyze with data. These can include defects, errors, complaints, costs, and so on. Also identify the appropriate unit of measure for each of these (such as number of frequency of occurrence impact).
2. Collect data: For a given time period, gather data on each of the causes. For example, if one of the causes is "submissions arrive with missing information," track and record the number and percentage of submissions where this occurs.
3. Rank the issues: Arrange the issues in descending order based on their frequency or impact, starting with the most significant problem at the top.
4. Calculate cumulative percentage: Calculate the cumulative percentage by adding up the percentages of each issue as you go down the list.
5. Plot the graph: Construct a graph by plotting the ranked issues along the horizontal axis (x-axis), and their respective frequencies or impacts along the vertical axis (y-axis). Also, include a line graph illustrating the cumulative percentages to show the cumulative impact or contribution of each issue.
6. During the meeting, review the graph and identify the vital few: Compare the frequency or other measure of each category relative to all the others. Identify the "vital few" issues that contribute to approximately 80% of the total problems or impacts.
7. Put it to work: To solve (or significantly reduce) the problem, address the one or two causes that are most responsible for the problem – instead of implementing a laundry-list of actions that may or may not have any real impact.
|
• Share a template and build the diagram together. |