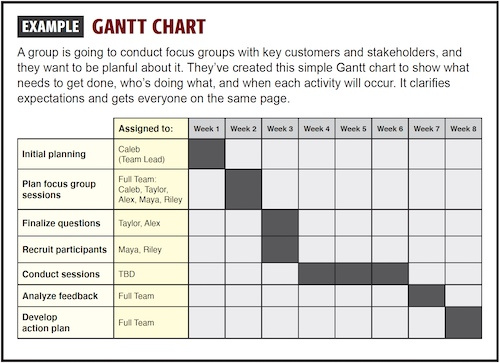
A Gantt chart is a visual tool to capture key information for all the tasks you're coordinating – all in one place. With a quick look, you can see what needs to happen and when. It helps people stay organized and know if they're on track with their tasks and activities.
Visual:
Click to expand – will open in a new window
Free online Gantt chart software
No registration or download required • Save your charts on your computer or to the
cloud
Step by step:
1. List the tasks: Write down all the tasks and activities that need to be coordinated.
2. Determine priorities and dependencies: Decide which tasks are most important or urgent, then identify tasks that must be completed before others can start. Sequence the task list accordingly.
3. Set time frames: Establish realistic timelines or deadlines for completing each task.
4. Assign responsibilities: Determine who will be responsible for each task or step.
5. Compile the information: Enter all the information into a table, with each task/activity filling a row, and columns showing time frames (start and end dates/weeks/months). Sequence and overlap the various steps as needed to show dependencies and when certain activities will be occurring at the same time. Excel works well for this. (The table format gives the Gantt chart its useful visual element.)
6. Put it to work: Regularly review your action plan to know what needs to be done and when, to monitor progress, and to make adjustments as needed.
7. Review and adjust: Periodically review the action plan, evaluate progress, and make necessary adjustments to stay on track.
|
• Use a shared spreadsheet to capture plans as they're discussed. |