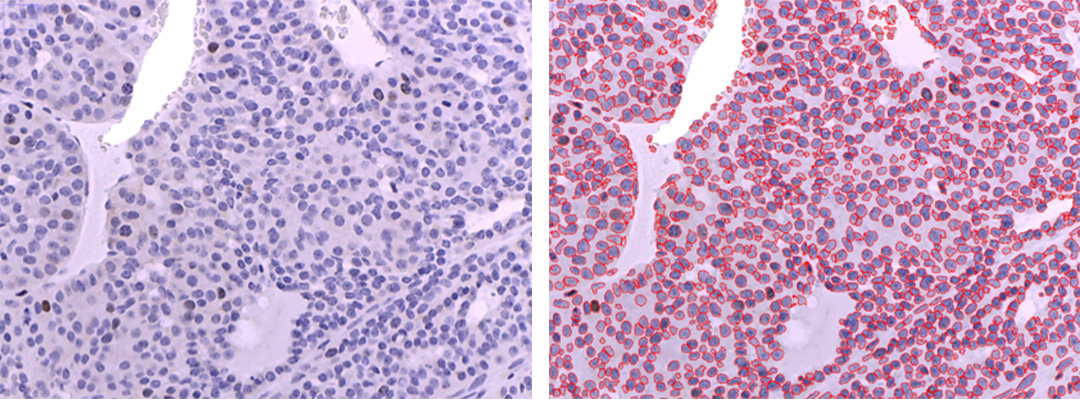
Histochemistry: Automatic Detection of Nuclei
| Project | Sample | Method |
|---|---|---|
| Total Cell Number Counting | Mice Breast Tumor Tissue | Hematoxylin Counterstaining |
PI: Professor Kiaris Hippokratis, Ph.D.
Project leaders: Youwen Zhang, Elena Farmaki, Ph.D.
ImageJ macros: Vitali Sikirzhytski, Ph.D.
Custom Imagej macros allows user to count number of nuclei (cells) on hematoxylin counterstained IHC slides. The user selects the best threshold for every IHC image or automatically applies the same threshold to all images in the folder. The smallest size of nucleus to be counted (the default value is 50 pixels) and initial threshold can be set within the “Parameters “ section of the macros. The obtained statistics are saved as a results.csv file (see the table below). Almost 100% of nuclei were detected correctly within the test images. However, some big cells can be misinterpreted as two or more cells. In some cases, non-cellular components with a high contrast can be misassigned to “nuclei” class.
| # | File Name | Number of Nuclei |
|---|---|---|
| 1 | Image_1.tif | xxx |
| 2 | Image_2.tif | yyy |
| 3 | Image_3.tif | zzz |
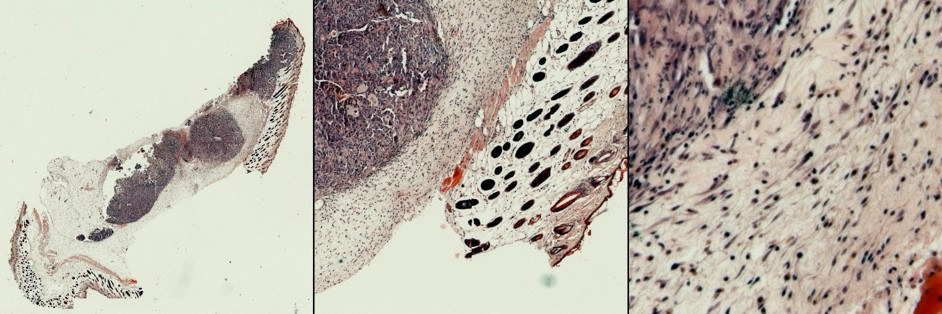
Histochemistry: Quantification of Tumor Area
| Project | Sample | Method |
|---|---|---|
| Estimation of Tumor Area | HER2 (+) xenograft | Hematoxylin and Eosin Staining (H & E) |
PI: Associate Professor Eugenia Broude, Ph.D.
Project leaders: Amanda Sharko, Ph.D., Gary Schools, Ph.D.
Image and Image Processing: Vitali Sikirzhytski, Ph.D.
Instrumentation: Leica DMIRE2 microscope, Zeiss AxioCam MRc color camera, automation by Inscoper cube and custom software, 20x C PLAN NA 0.3 PH1 Leica objective, automatic focusing using reference points.
Tissue sections were imaged using automatic XY scanning and autofocus. The section shown above (left panel) required about 15 min of imaging time. It consists of 676 single images (26 x 26; see the right panel for the example of a single image) stitched using custom ImageJ script. Transitions between single images are not noticeable due to custom flat field correction algorithm. We use scaled down mosaics to estimate size of tumor areas and original high-quality images to evaluate staining, sectioning, and assess morphological changes.
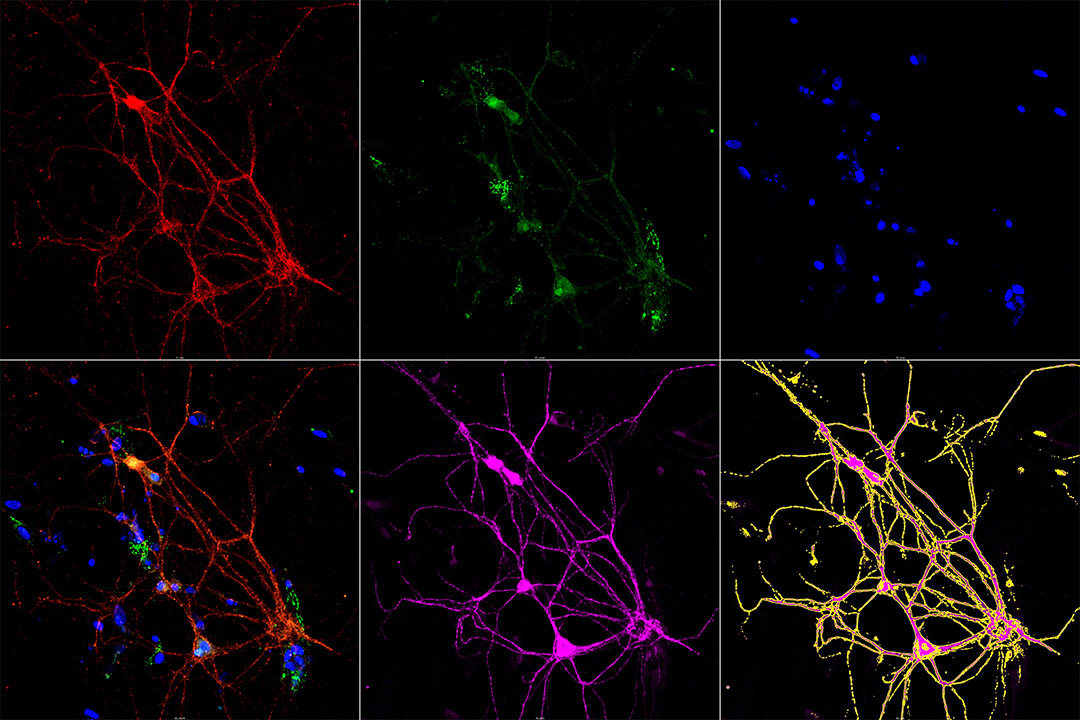
Immunofluorescence: Quantitation of Protein Levels in Neurons
| Project | Sample | Method |
|---|---|---|
| Quantification of Protein Levels in Neurons | Primary neuron culture from embryonic rodent cerebral cortex | Immunostaining |
PI: Associate Professor Eugenia Broude, Ph.D.
Project leaders: Gary Schools, Ph.D., Aksenova Marina, Ph.D., Amanda Sharko, Ph.D.,
Image and Image Processing: Gary Schools, Ph.D.
ImageJ Scripting: Vitali Sikirzhytski, Ph.D.
Instrumentation: Zeiss confocal laser scanning fluorescence microscopy LSM 700, ZEN black software, 20x Plan-Apochromat NA 0.8 Brightfield Zeiss objective, 5 z planes at 1.5 μm intervals
Coverslips with primary neuron culture were imaged using XY scanning for 5 z planes. Maximum intensity projections were generated. Neurons were segmented (detected) using anti-MAP2 (microtubule-associated protein 2) channel (pink color). Several background correction and local contrast enhancement steps were used to make less intense thinner processes (dendrites) more detectable. The segmented neurons are shown as yellow ROIs (regions of interest) within the rightmost image of the second raw. Proteins of interest (red and green colors) are quantified using the defined ROIs. There is possibility to differentiate processes and cell bodies, however dead neurons (they often do not contain distinctive nuclei, blue color in our case) appearing under certain conditions may require manual verification of the results, as their “MAP2” footprints may have very peculiar shapes. Results are saved in two csv files. The developed script allows automatic segmentation of all images into a folder.
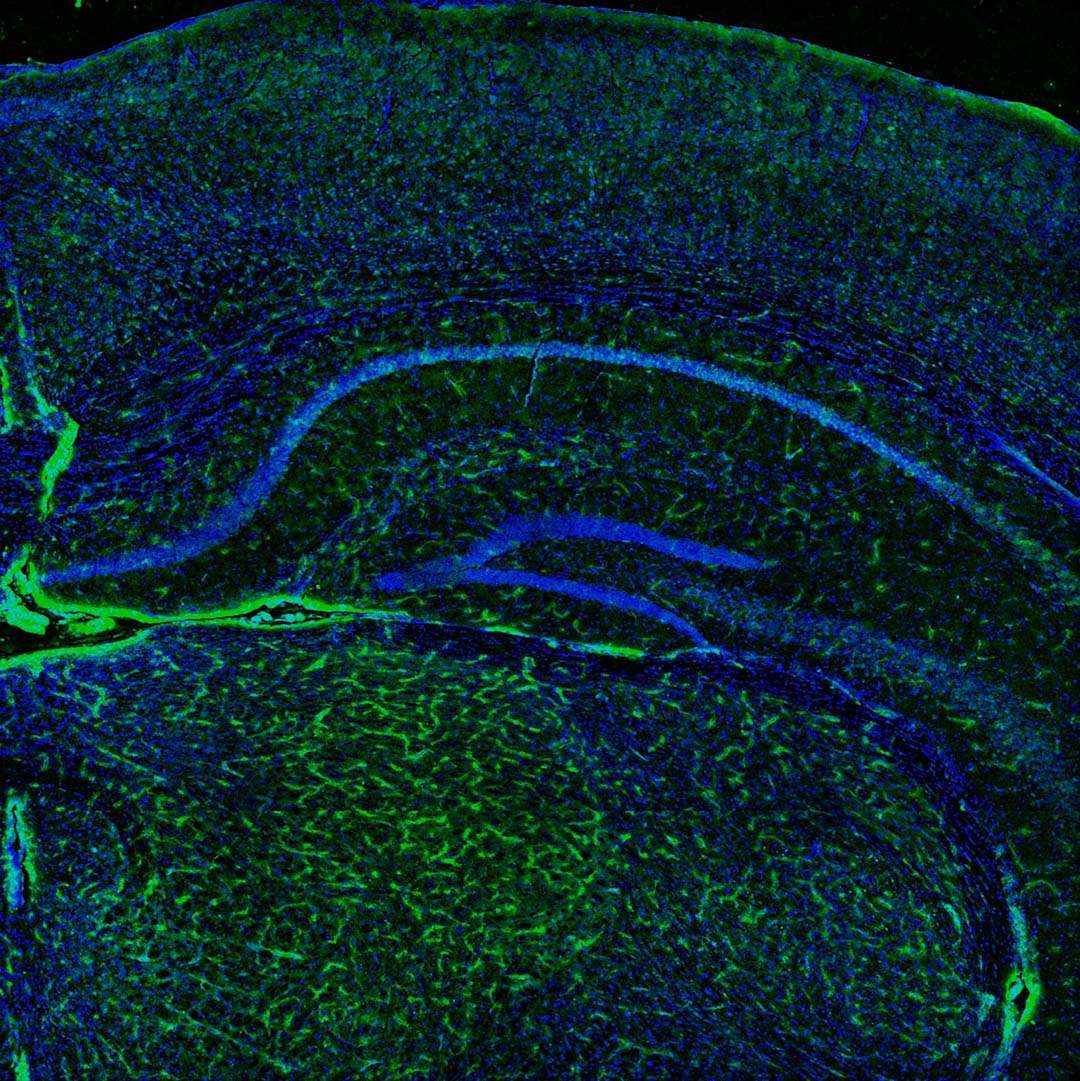
Immunofluorescence: Morphological Analysis of the Mouse Cerebral Vasculature
| Project | Sample | Method |
|---|---|---|
| Morphological Analysis of the Mouse Cerebral Vasculature | Array of Mice Brain Sections | Immunostaining |
PI: Professor Peisheng Xu, Ph.D.
Project leaders: Mingming Wang
Imaging: Mingming Wang, Vitali Sikirzhytski, Ph.D.
Image Processing: Vitali Sikirzhytski, Ph.D.
Instrumentation: Zeiss confocal laser scanning fluorescence microscopy LSM 700, ZEN black software, 20x Plan-Apochromat NA 0.8 Brightfield Zeiss objective, z planes at 2.5 μm intervals
Coverslips with mice brain sections were imaged using XYZ scanning (XY tilling, Z stack with 2.5 μm step). Blood vessels and nuclei were visualized using GFP-labeled CD31 (green color) protein and DAPI, fluorescent DNA Stain. 3D images were processed to minimize noise contribution and remove local background variation. Maximum intensity projections were generated after several local contrast enhancement steps used to make less intense thinner blood vessels more detectable.