The visibility map is a team tool for identifying where customers lose visibility into a process. Working stage by stage, teams assess what customers can see at each point and what is (or isn't) providing that visibility. The result is a practical set of improvements that help keep customers informed using existing tools, systems, and practices.
Materials needed: Butcher block paper or a large wall surface, markers, sticky notes in three colors (green, yellow, red), tape.
Time needed: 90–120 minutes, depending on the complexity of the process.
Works well for: Processes where customers frequently ask for status updates or wonder where their request stands. Especially useful for identifying practical ways to improve visibility using existing tools, systems, and practices.
Before you begin: Ask everyone in the group to come prepared with a specific process where customers frequently ask for status updates or express frustration about not knowing where things stand. Also ask participants to think about the tools, systems, or practices your unit currently uses to keep customers informed – even if they are underused. The goal is to work from what exists, not from what you wish you had.
Visual example:
Click to expand – will open in a new window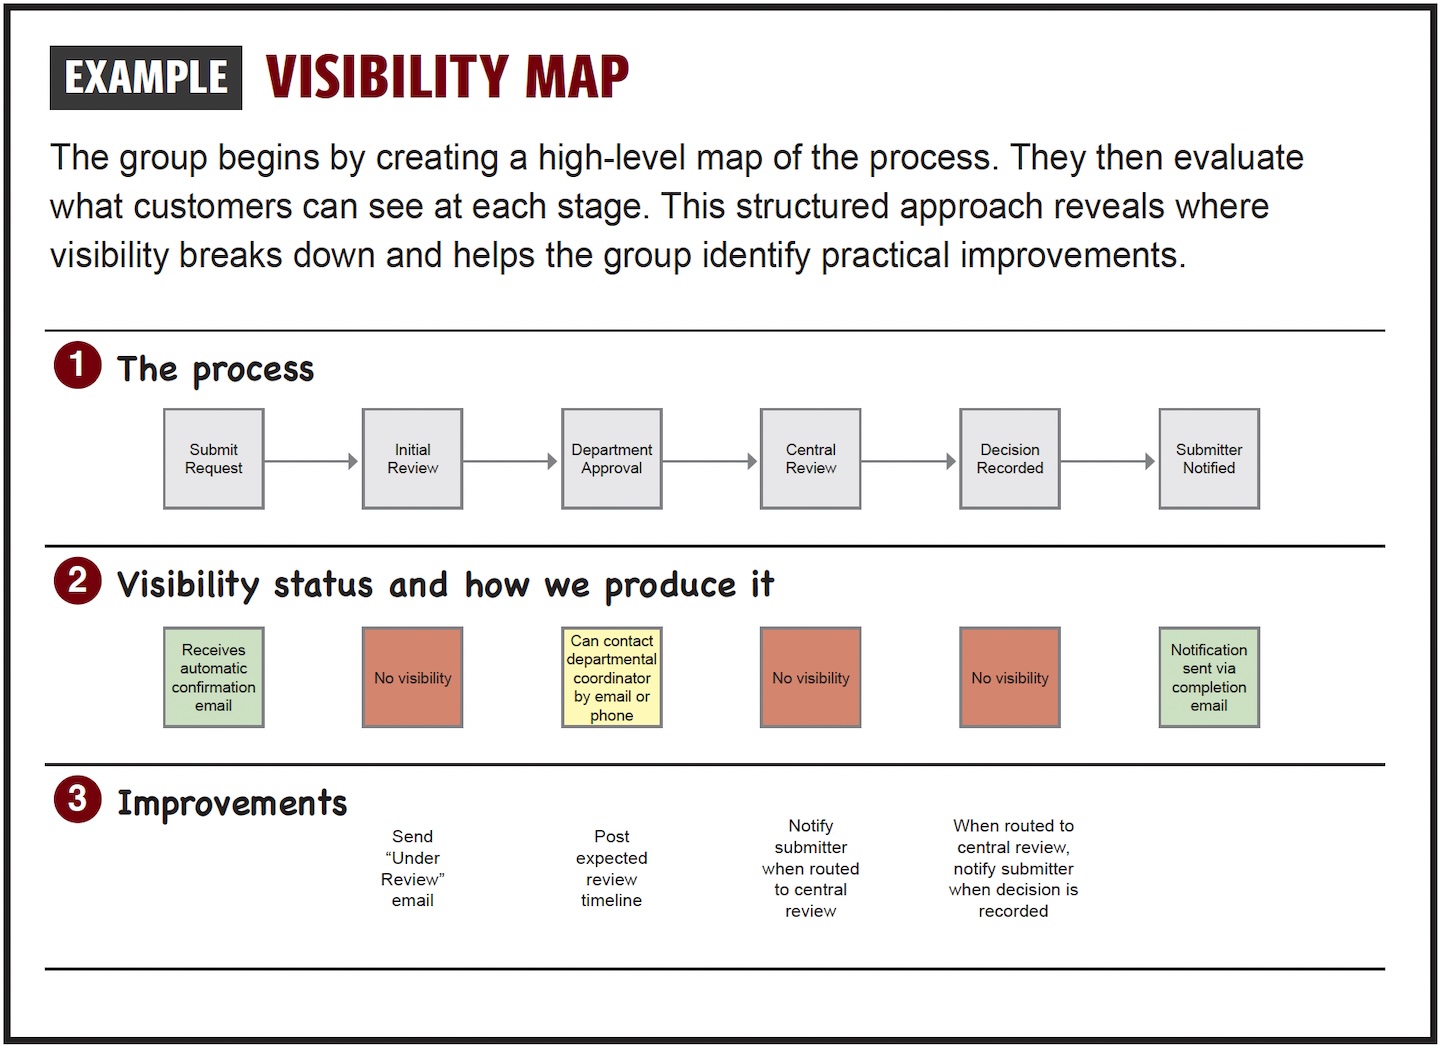
Step by step:
1. Set up your map: Roll out a large sheet of butcher block paper on a wall or table. Draw three horizontal lanes running left to right, stacked on top of each other. Label them on the left side.
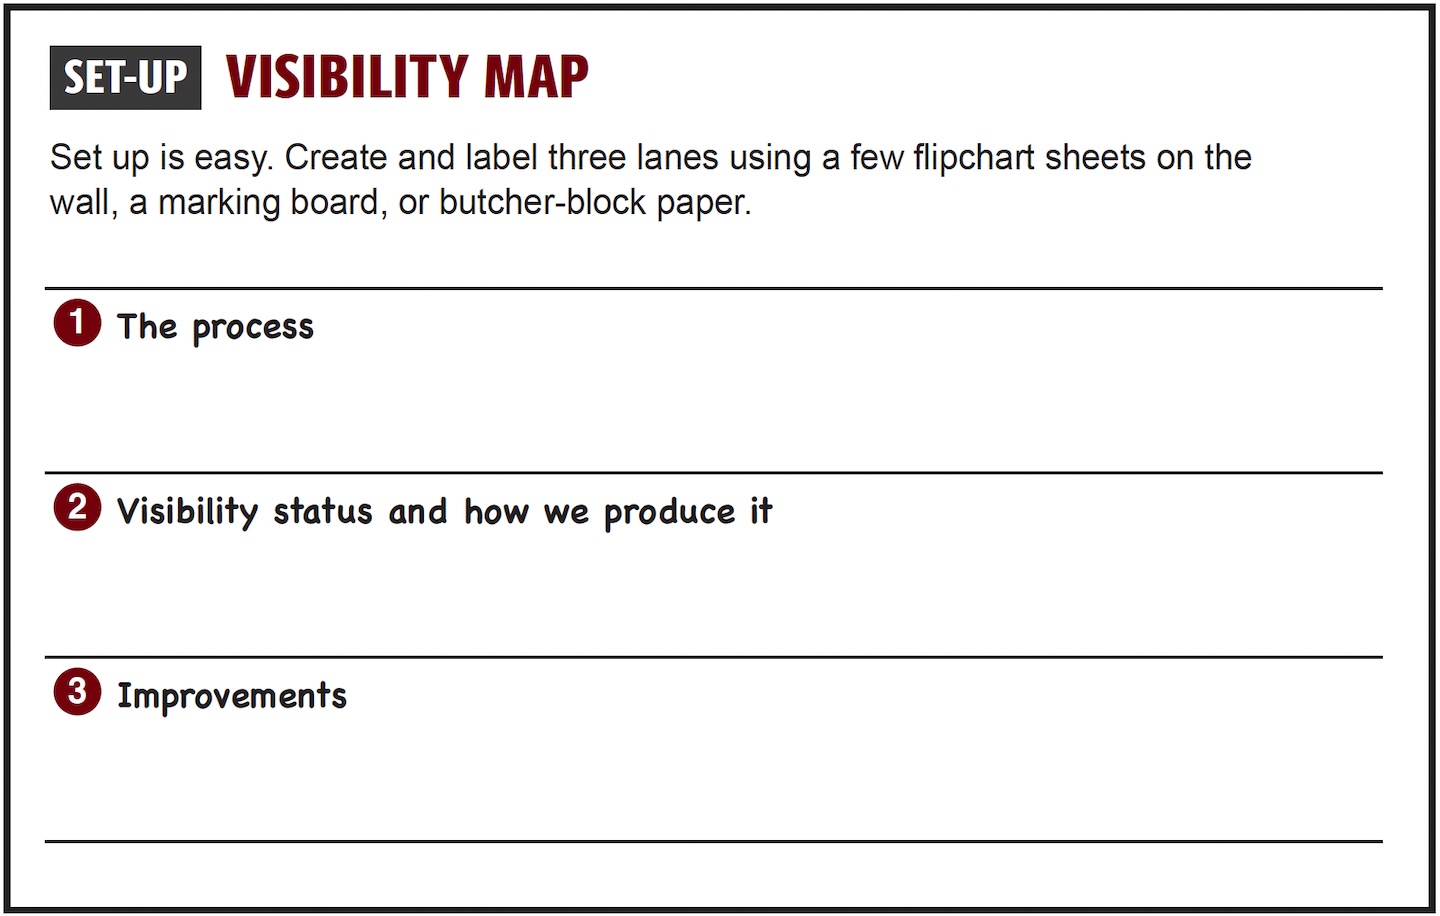
Leave plenty of space in each lane – you'll be adding sticky notes as you go. Have all three colors of sticky notes ready before you start.
2. Lane 1 – Map the process: Working left to right, identify the key stages of the process from the moment something is submitted through to resolution – no more than eight macro steps. Write each stage on a sticky note and place them in order across lane one. Keep it high level. This is the shared foundation everything else builds on. If possible, have this prepared ahead of time so the group can move quickly into lanes two and three.
3. Lane 2 – Visibility status and how we produce it: This is the diagnostic heart of the exercise. Working stage by stage across the map, the group assesses what customers can see at each point. At each stage, place a colored sticky note to indicate the customer's visibility status:
- Green = the customer can see where things stand
- Yellow = the customer can ask someone, but has to initiate it
- Red = the customer is in the dark – no information, no way to check
On each green and yellow note, briefly identify what provides that visibility – for example, a ticketing system, an automated confirmation email, a posted turnaround time, or a shared tracker. The color provides an instant visual read; the note explains why. A red note is one of the most important findings the group can surface – it shows that customers are in the dark and nothing is currently in place to help them.
As you work through this lane, watch for two things:
-
The temptation to default to yellow. "Customers can always call us" is not the same as having visibility. The question is whether customers can find out where things stand without having to chase someone down.
-
Variation in available tools. Some units have ticketing systems; others have a shared inbox and spreadsheet; others have almost nothing. Stay focused on what exists today, not on what you wish you had.
4. Step back and look at the whole picture: With lanes one and two complete, ask the group to step back and look at the map as a whole. Where are the biggest clusters of red? Where is yellow being used as a substitute for real visibility? These are the stages worth focusing on in lane three.
5. Lane 3 – The redesign: The capstone lane. Using what lanes one and two revealed, the group identifies the changes that would have the most impact on visibility. The goal isn't to redesign the process – it's to identify targeted improvements that are realistic and achievable using what the unit already has.
For each improvement, ask: what would this look like in practice? Who would be responsible for making it happen? Capture the improvements directly in lane three.
Watch for the technology trap, in which groups conclude they can't improve visibility until they have better systems. Redirect toward what's possible right now. A confirmation email sent within 24 hours of receiving something is a real visibility improvement. So is a posted turnaround time, or a single designated contact named at a key stage.
6. Identify next steps and additional improvements: Move from the map to action. Identify the visibility improvements the group is committing to make, and capture any additional ideas that surfaced during the discussion. For each commitment, identify an owner and a realistic timeframe. Record these in an action plan before the group concludes.
Before you leave the room, be sure to capture: the visibility improvements the group is committing to, who owns each one, and a realistic implementation timeframe. Take a photo of the completed map before it comes down – it's a useful reference as the group follows through on its commitments.