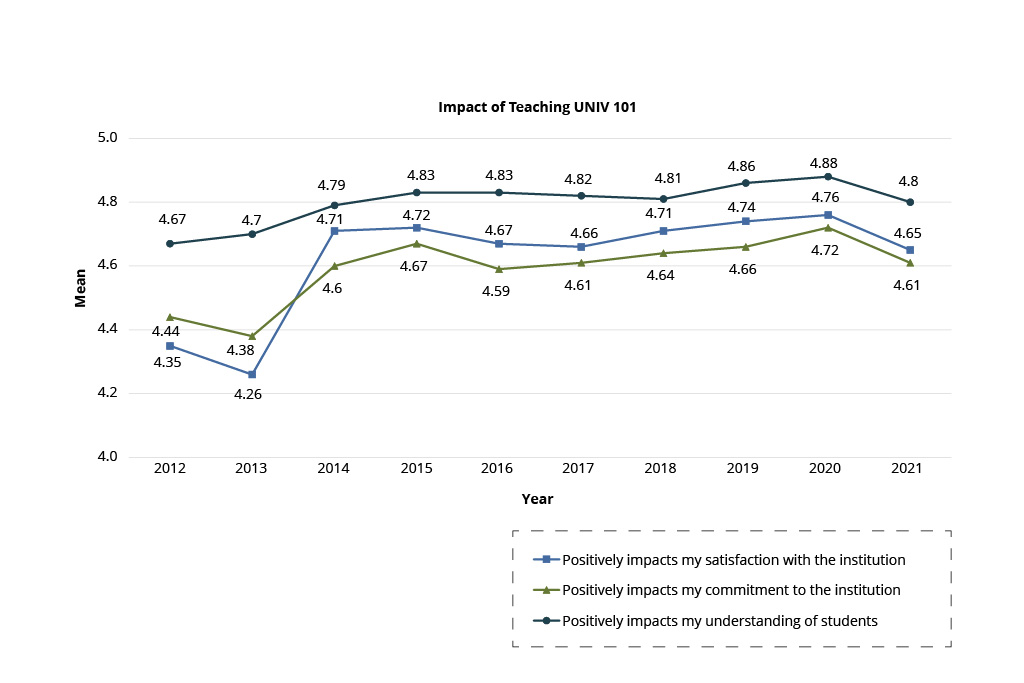
Responses on the fall 2021 University 101 Faculty Survey indicate instructors continue to be positively affected by their experience teaching the course (see Table 1, Figure 1, and Figure 2). Instructors report that teaching University 101 increases their satisfaction and commitment to USC, improves their understanding of students, expands their network of colleagues within the institution, and helps them learn things they can apply to their other professional responsibilities. Instructors who teach other courses in addition to University 101 also report that teaching the first-year seminar helps them improve their teaching in those courses.
The University 101 Faculty Survey is administered online to all University 101 instructors at the end of the fall semester. Instructors are invited to participate and provided a link to the survey via email. The survey asks instructors to indicate their level of agreement with statements about their teaching experience (strongly agree, agree, neutral, disagree, or strongly disagree) and rate the value of faculty development initiatives and instructional resources provided by the University 101 Programs office (very valuable, valuable, moderately valuable, slightly valuable, not at all valuable). In fall 2021, the response rate for the survey was 77.2%.
Table 1
Impact of Teaching University 101 on Instructors, Fall 2021
|
Teaching University 101… |
n |
Mean |
% Agreed |
|
Positively impacts my satisfaction with this institution. |
156 |
4.65 |
95.5% |
|
Positively impacts my commitment to this institution. |
156 |
4.61 |
93.6% |
|
Positively impacts my understanding of students. |
157 |
4.80 |
98.7% |
|
Increases my network of colleagues within the institution. |
156 |
4.48 |
89.7% |
|
Helps me learn things that I can apply to my other professional responsibilities. |
156 |
4.60 |
94.9% |
|
Helps me improve my teaching in other courses. |
43 |
4.40 |
86.1% |
Note. Data from fall 2021 University 101 Faculty Survey. Mean on 5-point scale. Percentage represents the number of instructors who strongly agreed or agreed with the statement.
Impact of teaching University 101 on instructors, fall semesters 2012-2021. Data retrieved from University 101 faculty survey and presented on 5-point scale.
Impact of teaching University 101 on instructors, fall semesters 2012-2021 (cont.). Data retrieved from University 101 faculty survey and presented on a 5-point scale.
The effectiveness of UNIV 101, as measured by student responses on end-of-course evaluations, continues to remain high. The Course Effectiveness factor mean was 4.48 on a 5-point scale in fall 2021 (N=4,043).
The Course Effectiveness factor measures the degree to which students agree with the following:
a. I recommend that future USC students take University 101. (M=4.60)
b. This course helped improve my transition to the University of South Carolina. (M=4.55)
c. University 101 helped me be a successful student. (M=4.47)
d. The content and topics covered in this course were relevant to my needs. (M=4.51)
e. Assignments in this class were helpful/meaningful. (M=4.37)
f. In this class, we learned a lot almost every day. (M=4.35)
g. Class time was well spent. (M=4.50)
h. Taking University 101 has been a valuable experience. (M=4.52)
Research suggests that helping students establish a sense of belonging is the number one predictor of their decision to persist to their second year.
The purpose of this study was to determine which factors on the First-Year Initiative survey* best predicted student persistence to the second year of college. The FYI is a nationally benchmarked instrument used to measure the effectiveness of a first-year seminar. The data were collected through a web-based survey at the end of the fall 2008 semester from students enrolled in University 101 at the University of South Carolina. 2,014 completed the survey, yielding a response rate of 72%. Responses from the FYI survey were matched with information from the student data file (persistence and first-year grade point average) to provide additional outcomes to measure student success. After eliminating missing data, 1,446 students remained in the analysis.
EBI**, who administered and disseminated the data, created 15 factors from a series of questions on the FYI survey. These 15 factors represent a number of vetted good practices and campus initiatives that are grounded in theoretical and empirical evidence. To predict the effectiveness of these factors on persistence into the second year, a series of logistic regressions were conducted. A number of control measures — gender, race and high school grades — were introduced into the model to isolate the effect of each factor on student persistence. Because of the high multicollinearity between the 15 factors, each factor was introduced into the model separately. When a regression model has high multicollinearity, this suggests that the independent variables (i.e. the 15 factors) are highly correlated with one another. The relationships between each factor and the dependent variable (i.e. persistence) become inflated and magnify the differences between coefficients. As such, each factor was introduced into the regression model separately to measure the unique relationship between the factor and persistence.
*In 2013, the First-Year Initiative survey was revised and renamed the First-Year
Seminar Assessment.
**In 2015, EBI changed its name to Skyfactor.
The regression analyses yielded significant effects on two factors:
- sense of belonging and acceptance
- overall satisfaction with the university
A standard deviation increase in sense of belonging and acceptance increased the odds of persisting into the second year by 38% (p < 0.001), holding all other variables constant. On a scale from 1 to 7, the mean was 5.62 — with 95% of the students measuring between 5.55 and 5.69 — and a standard deviation of 1.33. Furthermore, a standard deviation increase in overall satisfaction with the university increased the odds of persisting into the second year by 94% (p < 0.001), holding all other variables constant. The mean for this factor was 5.74, with 95% of the students measuring between 5.68 and 5.80 and a standard deviation of 1.23.
It is important to note that the mean for each factor was relatively high. This suggests that students who participated in the survey had a high sense of belonging and acceptance and overall satisfaction with the university. Moreover, the standard deviations for each factor were low, indicating low variability between the scores on each factor. In other words, very few students indicate having a low sense of belonging and acceptance and a low overall satisfaction with the university. The extent to which we can surmise that the seminar is having a positive effect on these outcomes cannot be determined because we do not have complementary data for students who did not participate in the course.
However, this should not deter from the overwhelming significance that sense of belonging and acceptance and overall satisfaction with the university have on student persistence. Moreover, these data suggest that efforts targeted toward enhancing students’ sense of belonging and acceptance and overall satisfaction with the university will increase their likelihood of persisting into the second year.
End-of-course evaluations from fall 2021 show the vast majority of UNIV 101 students agreed their peer or graduate leader made valuable and beneficial contributions to their UNIV 101 classroom and first-semester experience (see Table 1). End-of-course evaluations presented students with a series of six statements about their peer or graduate leader and asked them to indicate their level of agreement (strongly agree, agree, neutral, disagree or strongly disagree) with each item. Statements measured the peer and graduate leaders’ contributions in the classroom, their approachability and their stature as a role model and resource, as well as their role in helping students make a successful transition to college. Students also were asked to evaluate the peer and graduate leaders’ impact on their overall UNIV 101 experience.
Table 1
Peer and Graduate Leader Contributions to the University 101 Student Experience, Fall 2021
| My Peer/Graduate Leader... | n | Mean | % Agreed |
|---|---|---|---|
| Made important contributions to our class. | 3799 | 4.86 | 97.9% |
| Was approachable. | 3796 | 4.88 | 98.1% |
| Was an appropriate role model. | 3796 | 4.88 | 98.0% |
| Was a valuable part of my University 101 experience. | 3798 | 4.84 | 97.1% |
| Helped me make a successful transition to the university. | 3797 | 4.78 | 95.2% |
| Was a valuable resource. | 3797 | 4.83 | 96.8% |
Note: Data from fall 2021 UNIV 101 end-of-course evaluation. Mean on 5-point scale. Percentage represents the number of students who strongly agreed or agreed with the statement.
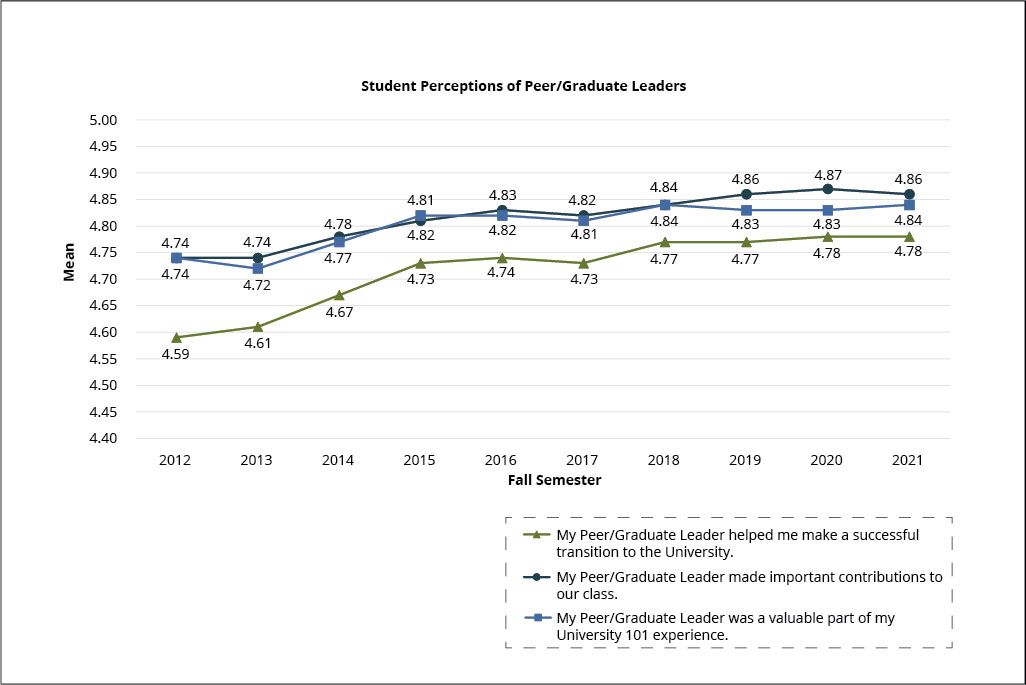
Figures 1 and 2 present longitudinal data showing that students’ satisfaction with their peer and graduate leaders’ contributions is high each year.
Figure 1
Student satisfaction with peer and graduate leaders’ role and contributions, fall
semesters 2012-2021. Data retrieved from UNIV 101 end-of-course evaluations and presented
on a 5-point scale. Note: Peer and graduate leaders’ approachability was not addressed
on end-of-course evaluations prior to 2014.
Figure 2
Student satisfaction with peer and graduate leaders’ role and contributions, fall
semesters 2012-2021 (cont.). Data were retrieved from UNIV 101 end-of-course evaluations
and presented on a 5-point scale.
Research suggests that peer and graduate leaders who get matched with a co-instructor by the University 101 Programs office have the same satisfaction with their role and teaching partner as those who find a match on their own.
Data from the fall 2016 end-of-semester University 101 peer and graduate leader evaluations were analyzed to determine whether the process used to match students with co-instructors — either a student and co-instructor making a match on their own, or a match made by the University 101 Programs office — had any impact on the peer or graduate leader’s subsequent satisfaction with his or her role in the UNIV 101 classroom or relationship with his or her co-instructor.
Peer leaders indicated on their Peer Leader Program Evaluation whether or not they knew their co-instructor before being matched; graduate leaders indicated on their Graduate Leader Survey whether or not they selected their co-instructor on their own. Both the Peer Leader Program Evaluation and the Graduate Leader Survey asked respondents to report the degree to which they were satisfied with their role in the classroom. The wording of questions regarding the students’ relationships with their co-instructors differed between the surveys (see Tables 1 and 2), but each addressed the degree to which the students were satisfied with the relationship.
Data were analyzed to find differences in means on the selected questions for each group. Independent samples T-tests yielded no significant differences between peer leaders or graduate leaders who made a match on their own and those that had a match made by the University 101 Programs office.
Peer Leader Satisfaction with Class Role and Relationship with Co-Instructor
| Evaluation Criteria | Knew Co-Instructor Before Match Means (n) |
Did Not Know Co-Instructor Before Match Means (n) |
(p) |
|---|---|---|---|
| I was satisfied with my role in the UNIV 101 classroom. | 4.36 (36) | 4.42 (104) | .695 |
| I was satisfied with my relationship with my UNIV 101 co-instructor. | 4.53 (36) | 4.51 (104) | .911 |
Note: Data from fall 2016 Peer Leader Program Evaluation
Graduate Leader Satisfaction with Class Role and Relationship with Co-Instructor
| Evaluation Criteria | Selected My Co-Instructor On My Own Means (n) |
Paired by University 101 Means (n) |
(p) |
|---|---|---|---|
| I was satisfied with the role I had in my UNIV 101 class. | 4.62 (13) | 4.35 (17) | .338 |
| If I had it to do over again, I would work with the same instructor again. | 4.46 (13) | 4.24 (17) | .604 |
Note: Data from fall 2016 Peer Leader Program Evaluation
Research suggests that first-year seminar courses co-taught by a peer or graduate leader are more effective than classes taught only by an instructor.
Research about peers has found that students can, and often do, have significant positive impacts on the development and learning of their peers. To that end, University 101 Programs utilizes peer and graduate leaders as resources, mentors and co-facilitators in the UNIV 101 course.
Data from the 2013 First-Year Seminar Assessment were analyzed to determine the impact of peer/graduate leaders on the UNIV 101 course, as measured by the FYSA's Overall Program Effectiveness factor. The overall program effectiveness factor assesses the degree to which students report the course:
- included interesting subject matter
- contributed to their ability to succeed academically
- contributed to their ability to adjust to the college social environment
- covered topics important to the student
- is one to recommend to other first-year students.
The FYSA is administered at the end of each fall semester to all students enrolled in UNIV 101. In 2013, the instrument was sent to 3,848 students and yielded a 59% response rate (n=2272). The dataset was coded to include a variable that indicated if a section was assigned a peer or graduate leader or had no teaching partner assigned. In fall 2013, 191 sections of UNIV 101 were assigned a peer or graduate leader while 22 sections had no teaching partner. The data were analyzed to find differences in means on overall program effectiveness between sections that had a teaching partner and those that did not. An independent samples T-test yielded significant differences in overall program effectiveness for sections of the course with a peer leader (M=5.49, SD=1.56) and sections without a peer leader (M=5.14, SD=1.78); t(2270)= 9.46, p=.01
Figure 1
Impact of Peer/Graduate Leader on Overall Program Effectiveness. Data were retrieved from the First-Year Seminar Assessment and presented on a 7-point scale.